Description
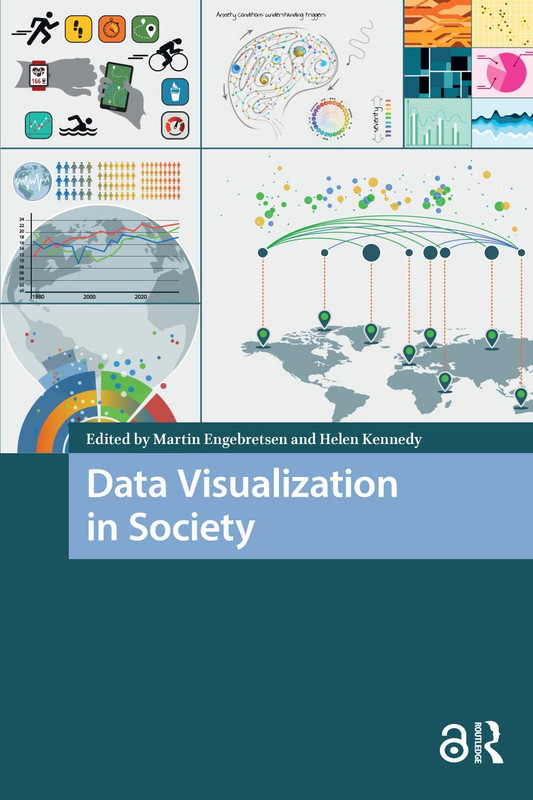
Data Visualization in Society
Data Visualization in Society explores how data shapes our understanding of the modern world and how visual storytelling impacts society, policy, and communication. This comprehensive course examines the power of data representation, its ethical implications, and how visual analytics can drive informed decisions across industries. Perfect for students, researchers, and professionals eager to harness the influence of data visualization for societal change.
Course Description
In today’s data-driven era, visualization has become more than a technical skill — it’s a form of communication that transforms numbers into narratives. The Data Visualization in Society course bridges the gap between data science and social science, helping learners understand how visual representations influence public opinion, media interpretation, and policy development.
Throughout this course, you’ll explore the history, techniques, and ethical challenges surrounding data visualization. You’ll analyze real-world examples from journalism, governance, healthcare, and social media to understand how visuals can both inform and mislead audiences. In addition, the course delves into accessibility, inclusivity, and the societal consequences of misused data imagery.
By the end of this course, you will be equipped to critically assess visual data, create responsible designs, and engage audiences with clarity and purpose. Whether you’re a data analyst, educator, journalist, or policymaker, these insights will help you apply visualization tools with ethical precision and creative flair.
What You’ll Learn
- The societal and cultural impact of data visualization
- How visual narratives shape public understanding
- Principles of ethical and inclusive data communication
- Critical analysis of real-world visualization case studies
- Best practices for creating impactful and accurate visuals
Requirements
- Basic understanding of data analysis and visualization tools
- Interest in social science, media, or communication
- No advanced programming skills required
About the Publication
This course is inspired by the academic publication “Data Visualization in Society”, a critical collection edited by renowned researchers exploring the intersection of design, culture, and ethics in visual data. The contributors provide global insights, examining how societies interpret and act upon visualized information.
Explore These Valuable Resources
- The Art and Science of Data Visualization – DataJournalism.com
- Data Visualization Basics – Tableau
- Visualising Data – Andy Kirk
Explore Related Courses
- Data Science Foundations
- Machine Learning Essentials
- Artificial Intelligence for Beginners
- Big Data Analytics
- Statistical Analysis and Visualization
Why Enroll in This Course?
Data visualization is not just about aesthetics; it’s about clarity, accuracy, and ethics. With this course, you’ll gain a multidisciplinary understanding that combines art, data science, and social awareness. Moreover, you’ll develop the critical thinking skills necessary to challenge misleading data and communicate insights responsibly.
Take a step forward in your career and become part of a growing community of ethical data communicators. Start learning today and turn data into a powerful force for societal good!














Reviews
There are no reviews yet.