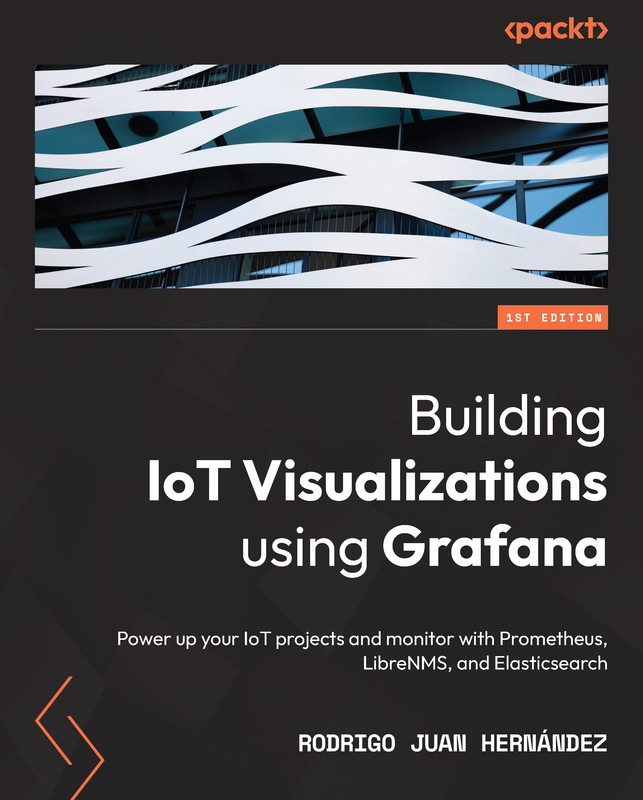
Building IoT Visualizations with Grafana: A Practical Guide
Master the art of creating real-time, interactive IoT visualizations with this practical IoT visualizations with Grafana guide. Learn how to collect, process, and display data from IoT devices using Grafana’s powerful features. Whether you’re a beginner or experienced data engineer, this course will help you create insightful dashboards for your IoT applications.
What You’ll Learn
- Setting up Grafana and integrating IoT data sources
- Creating real-time dashboards for IoT device monitoring
- Visualizing time-series data using Grafana panels
- Implementing advanced queries with Grafana and SQL
- Alerting and notification setups for IoT device anomalies
- Integrating Grafana with other IoT platforms and APIs
- Optimizing dashboard performance for large IoT datasets
- Deploying Grafana dashboards for cloud-based IoT solutions
Requirements
- Basic knowledge of IoT and data collection methods
- Familiarity with Grafana or dashboard tools is helpful, but not required
- Interest in data visualization and real-time analytics
Course Description
This IoT visualizations with Grafana guide is designed for those who want to leverage Grafana to create powerful, interactive visualizations of IoT data. Starting with basic setup and integration, you will learn how to collect and display real-time data from IoT devices on custom dashboards. Grafana’s flexible panels and powerful query features will allow you to present data clearly and effectively.
You will also explore how to configure alerts for anomaly detection, optimize performance for large-scale IoT systems, and integrate with other platforms to enhance the data collection process. By the end of this course, you’ll be able to build complex IoT dashboards that provide critical insights for monitoring devices, analyzing performance, and improving overall efficiency.
About the Instructor
This course is created by data engineers and IoT specialists with years of experience in building data visualizations and working with Grafana. You will benefit from their practical insights and expert guidance throughout the course.
Explore These Valuable Resources
Explore Related Courses
- IoT for Beginners
- Data Visualization with Python
- Advanced Grafana Dashboarding
- Cloud Deployment for IoT Applications
- Data Engineering for IoT Systems


